Graphic organizers are used to organize information, ideas, and concepts in a visual way. They can be particularly helpful to support understanding of the relationships between ideas and concepts.
You may find that you like one type better than another, or that certain types are a better fit for certain courses than others. Try them out and see what works for you!
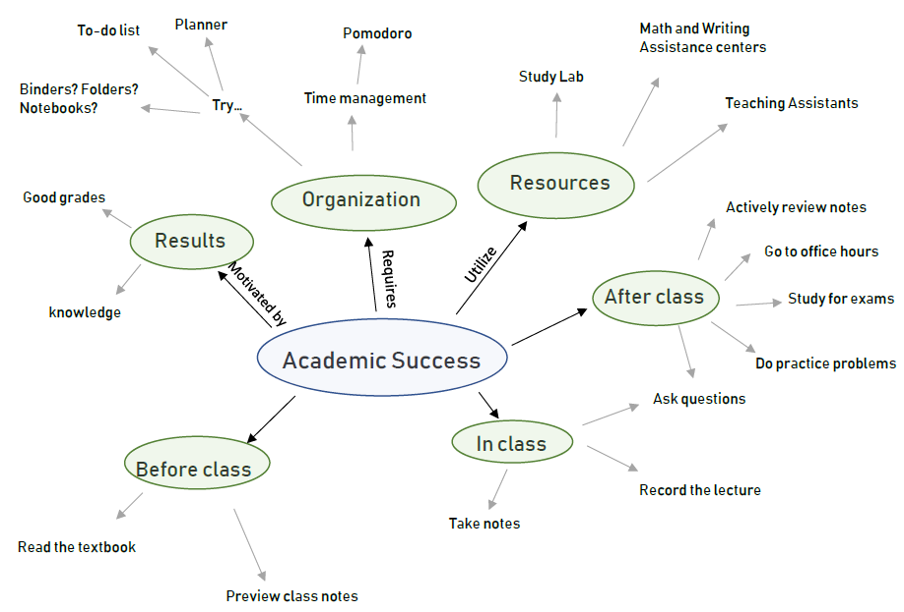
- Concept Maps
-
Concept maps show relationships between main concepts and their characteristics. They can be used to break down a topic or find relationships between concepts. The three types of concept maps are chains, spokes, and networks. You can add as many branches as you want as you get more detailed!
For a more detailed explanation, check out this video.
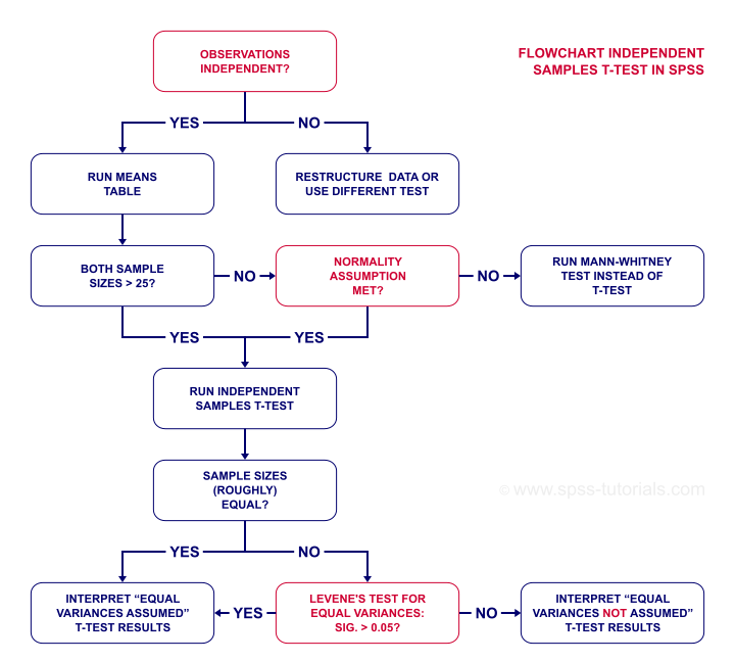
- Flow Charts
-
Flow charts are a diagram or a sequence of steps or events in a system or activity. They can help you visualize step by step processes, connect pathways to one another, or see how one idea can lead to many directions.
For more details, check out this video.
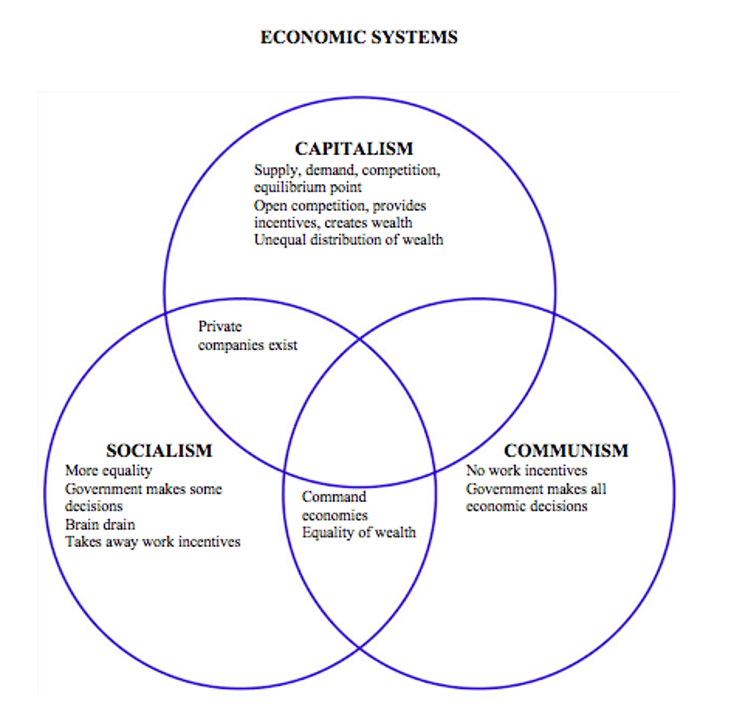
- Venn Diagrams
-
Venn Diagrams show the similarities and differences between two or more topics at the same time. They can be a quick strategy for summarizing big ideas into key components compared across concepts.
For more details, check out this video.
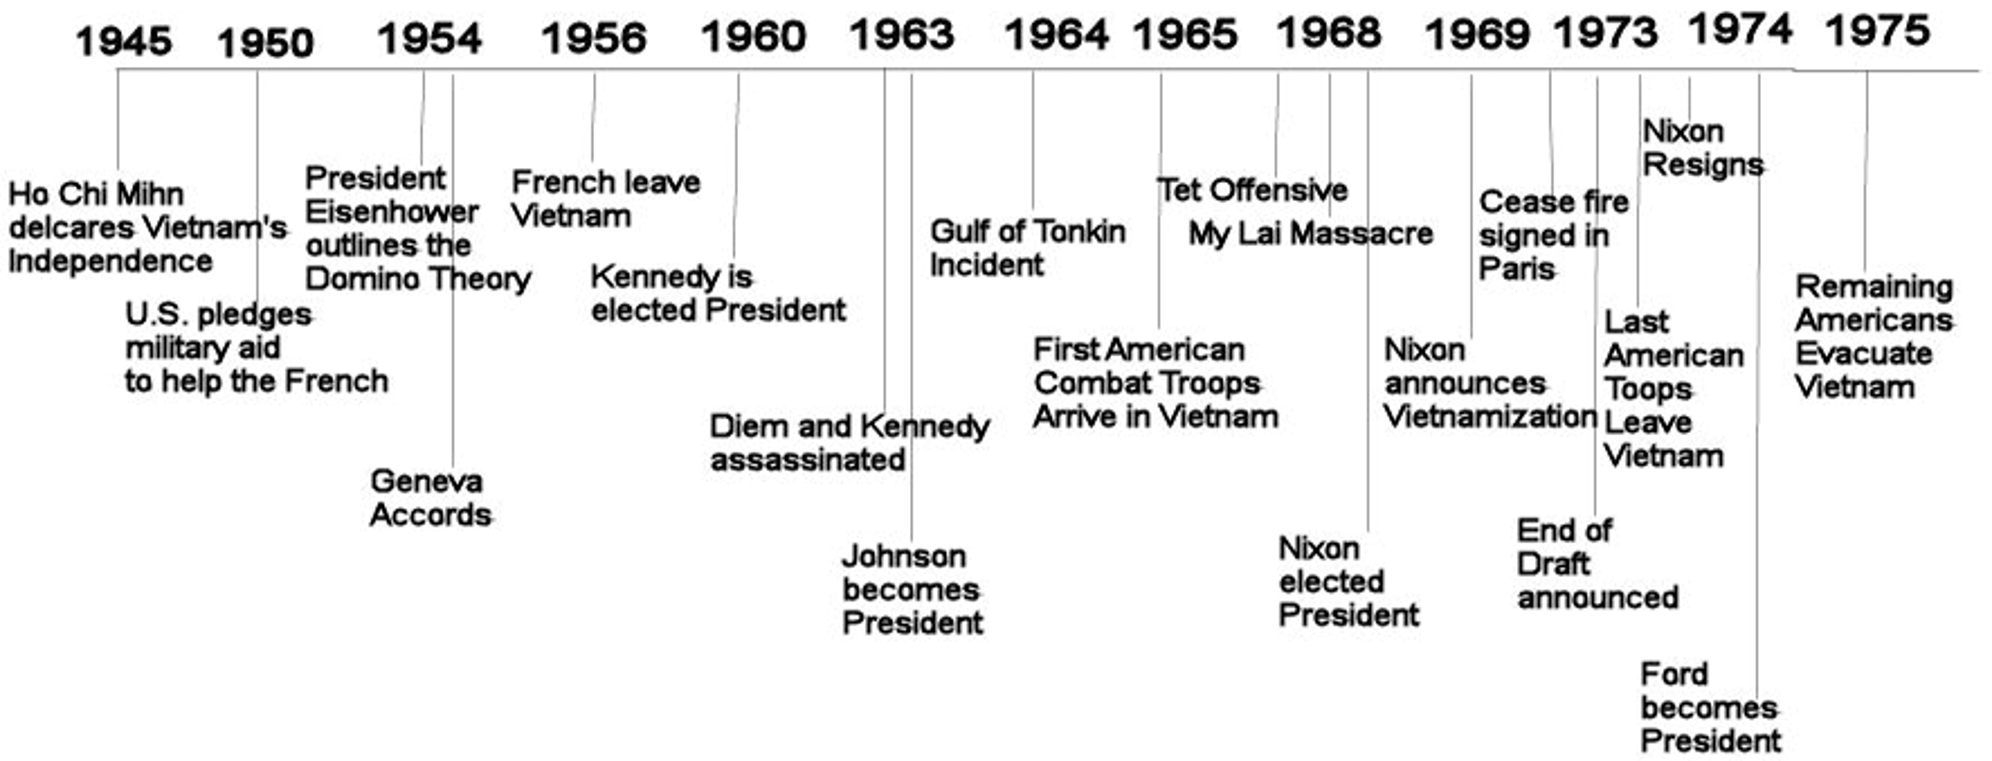
- Timelines
-
Timelines are fantastic graphic organizers to support learning in history courses, or any course with events that you need to understand. It can aid in giving you a big picture of how different events influence future events over time.
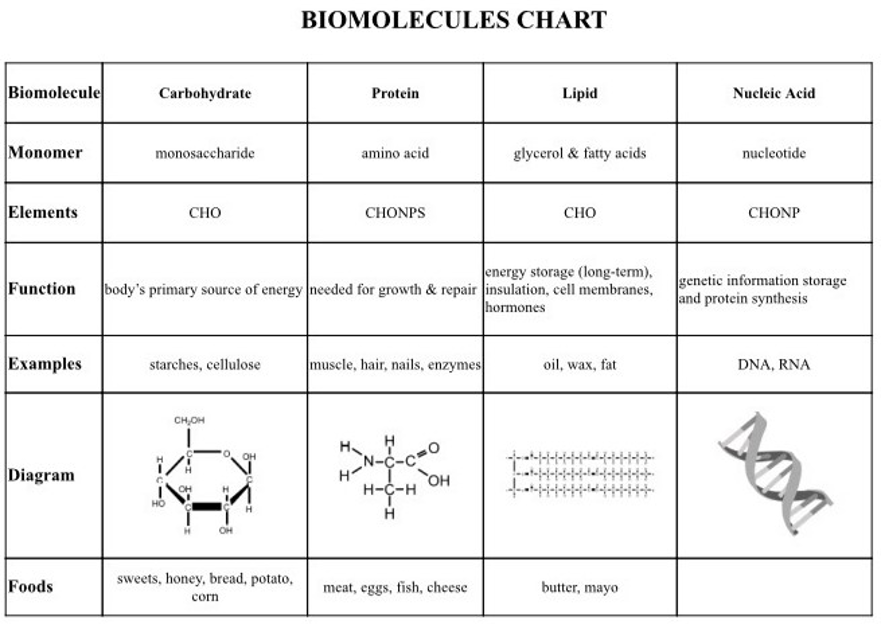
- Charts and Tables
-
Charts or tables can be helpful when you need to compare or contrast more than two or three concepts or look for patterns. It can use pictures to provide visual cues in addition to text.